How to Share an HTML Report or Dashboard Without Hosting
Export the report as a single self-contained HTML file, load big libraries like Plotly from a CDN to keep it small, then paste it into HTMLViewer.io, save it, and share the link. Restrict the link to specific email addresses when the data is sensitive, and export a PDF copy for archiving.
On this page
Data tools are great at producing HTML reports and bad at getting them in front of people. A Jupyter export, a Plotly dashboard or a pytest report opens perfectly on your laptop, then arrives in a manager's inbox as a broken attachment. You can share it as a link without setting up hosting: make the report self-contained, keep it small, paste it into a viewer that hosts it, and send the link.
Key Takeaways
- Most "broken report" problems come from multi-file exports. Export a single self-contained HTML file first.
- Load heavy libraries from a CDN. Plotly's embedded bundle alone is about 3 MB, and HTMLViewer.io allows 5 MB per document.
- Share sensitive reports with specific email addresses instead of a public link.
- Keep a PDF copy for archiving, since a link shows whatever version you last saved.
Why HTML reports break when you share them
HTML reports break because many exporters write the page plus a folder of supporting files, and only the page gets sent. The HTML still points at report_files/plot1.png or plotly.min.js, which don't exist on the recipient's machine.
There are two kinds of HTML report:
- Self-contained: one
.htmlfile with CSS, JavaScript and images inside it (often as base64 data URIs) or loaded from public CDNs. Anyone can open it anywhere. - Multi-file: an
.htmlfile plus a sibling folder or assets referenced by relative paths. It only works if the whole folder travels together and is served correctly.
Relative paths are the giveaway. Open the file in a text editor and search for src=" and href=". If you see paths like images/, _files/ or ./lib/, the report isn't self-contained yet.
How to make common reports self-contained
Most report tools already have a switch for a single-file export. Here's where it lives in the ones analysts and developers use most:
| Tool | Default output | Single-file option |
|---|---|---|
| Jupyter (nbconvert) | Images written as separate files | --embed-images |
Plotly (write_html) |
plotly.js embedded (about 3 MB) | Already single file; use include_plotlyjs="cdn" to shrink it |
| Quarto | HTML plus a _files folder |
embed-resources: true |
R Markdown (html_document) |
Self-contained by default | Keep self_contained: true |
| pytest-html | CSS and assets stored separately | --self-contained-html |
| pandas Styler | A <style> and <table> fragment |
doctype_html=True for a full page |
Jupyter notebooks
Convert with nbconvert and embed images so plots travel with the page:
jupyter nbconvert --to html --embed-images analysis.ipynb
The nbconvert docs describe --embed-images as embedding images as base64 URLs in the resulting HTML file. Without it, images are written separately.
Plotly dashboards
write_html produces one file, but by default it embeds the full plotly.js library. The Plotly API reference puts that source at about 3 MB and notes that include_plotlyjs="cdn" swaps it for a script tag pointing at the CDN:
fig.write_html("sales_dashboard.html", include_plotlyjs="cdn")
Avoid include_plotlyjs="directory" for sharing. It references a separate plotly.min.js file next to the HTML, which is exactly the kind of dependency that breaks.
Quarto and R Markdown
Quarto writes a _files folder by default. Add this to the document's YAML to bundle everything into one file, as the Quarto publishing docs describe:
format:
  html:
    embed-resources: true
R Markdown's html_document is standalone by default. The R Markdown book says it uses data: URIs for linked scripts, stylesheets and images. MathJax is the exception in both tools: it loads externally because of its size, which is fine because it comes from a public CDN.
Test and audit reports
Run pytest-html with --self-contained-html. The pytest-html user guide warns that images added as files or links still stay external, so attach screenshots as embedded content if you need them. Lighthouse's HTML report is a single file you can save from Chrome DevTools or the CLI, so it's usually ready to paste as is.
pandas tables
df.style.to_html() returns only a <style> block and a <table>. Pass doctype_html=True to get a complete page, per the pandas Styler docs. A fragment still previews fine, but the full page gives you a proper <title>.
Keep the report under 5 MB
HTMLViewer.io stores up to 5 MB per document, and a lean report also loads faster on your stakeholders' phones. The biggest wins:
- Load libraries from a CDN. Plotly, Chart.js, Bootstrap and similar libraries load normally from CDN URLs. Switching Plotly from embedded to
"cdn"removes about 3 MB per file. - Watch embedded images. Base64 makes an image roughly a third larger than its source, per MDN. Export plots as compressed PNG or SVG at a sensible resolution, not 300 DPI print quality.
- Aggregate before you plot. A scatter plot of 200,000 raw rows serializes every point into the HTML. Summarize or sample first, and link to the full dataset elsewhere.
- Drop unused output. Clear noisy notebook cells, debug prints and hidden widgets before exporting.
The editor shows the size of the pasted HTML, so you'll know before saving whether you're close to the limit. If a report can't get under 5 MB, or it's genuinely a multi-file site, static hosting such as GitHub Pages or Netlify Drop is the better fit.
How to share the report with HTMLViewer.io
Once the report is a single, reasonably sized file, sharing takes a couple of minutes. There's no file upload; you paste the HTML.
- Copy the HTML. Open the exported
.htmlfile in a text editor such as VS Code or Notepad, select all, and copy. - Paste and preview. Open HTMLViewer.io and paste into the code panel. The live preview runs the report's CSS and JavaScript, so interactive charts, tooltips and filters should work.
- Check for gaps. Scroll through. Missing images or blank chart areas mean something still points at a local file.
- Sign in and save. Sign in with Google and click Save. Give the document a clear name like "Q3 churn analysis, Sep 2026" so you can find it in your Documents list.
- Share it. Click Share, pick who can open it (public, or specific email addresses), and send the link.
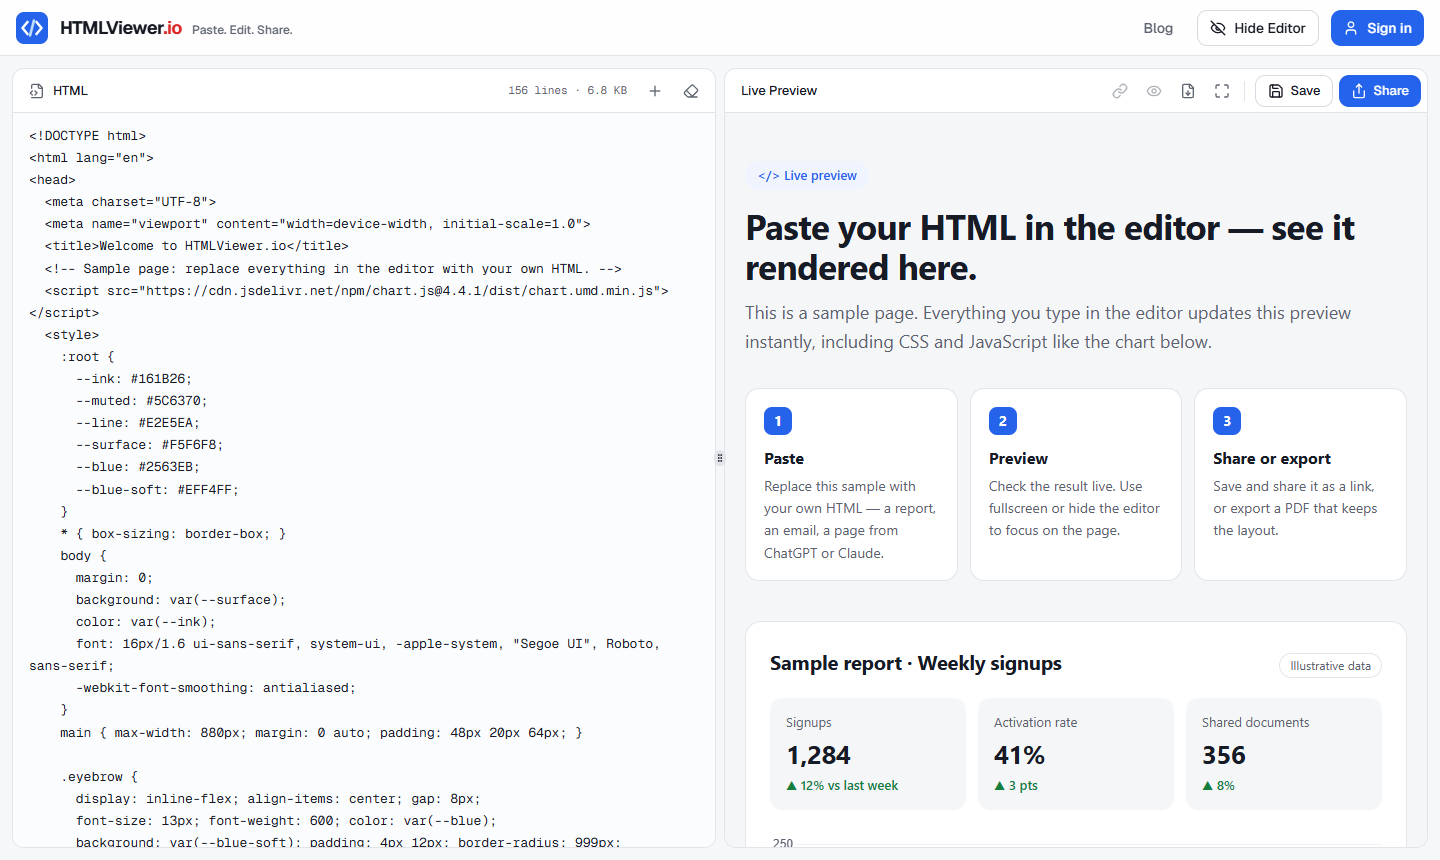
Recipients get the report at full width with a compact header that shrinks as they scroll, plus buttons to copy the link, go fullscreen or export a PDF.
Updating the report: the link shows the HTML you saved, not a live connection to your notebook. After you re-run and re-export, open the saved document, paste the new HTML over the old, and save again.
Keep report data private
Reports often hold revenue, customer or test-environment details, so share them with specific email addresses rather than a public link, and strip what stakeholders don't need (raw customer rows, internal hostnames, API keys left in notebook cells) before exporting. HTMLViewer.io has no password-protected or expiring links, so for regulated data use the reporting platform your organization has approved. The full privacy options, including revoking a leaked link, are in how to share an HTML file as a link.
Export a PDF copy for archiving
A link reflects whatever you last saved, so keep a PDF when you need a frozen record, such as a monthly report or an audit trail. Click Export PDF on the preview toolbar, or have a recipient use it from the share page.
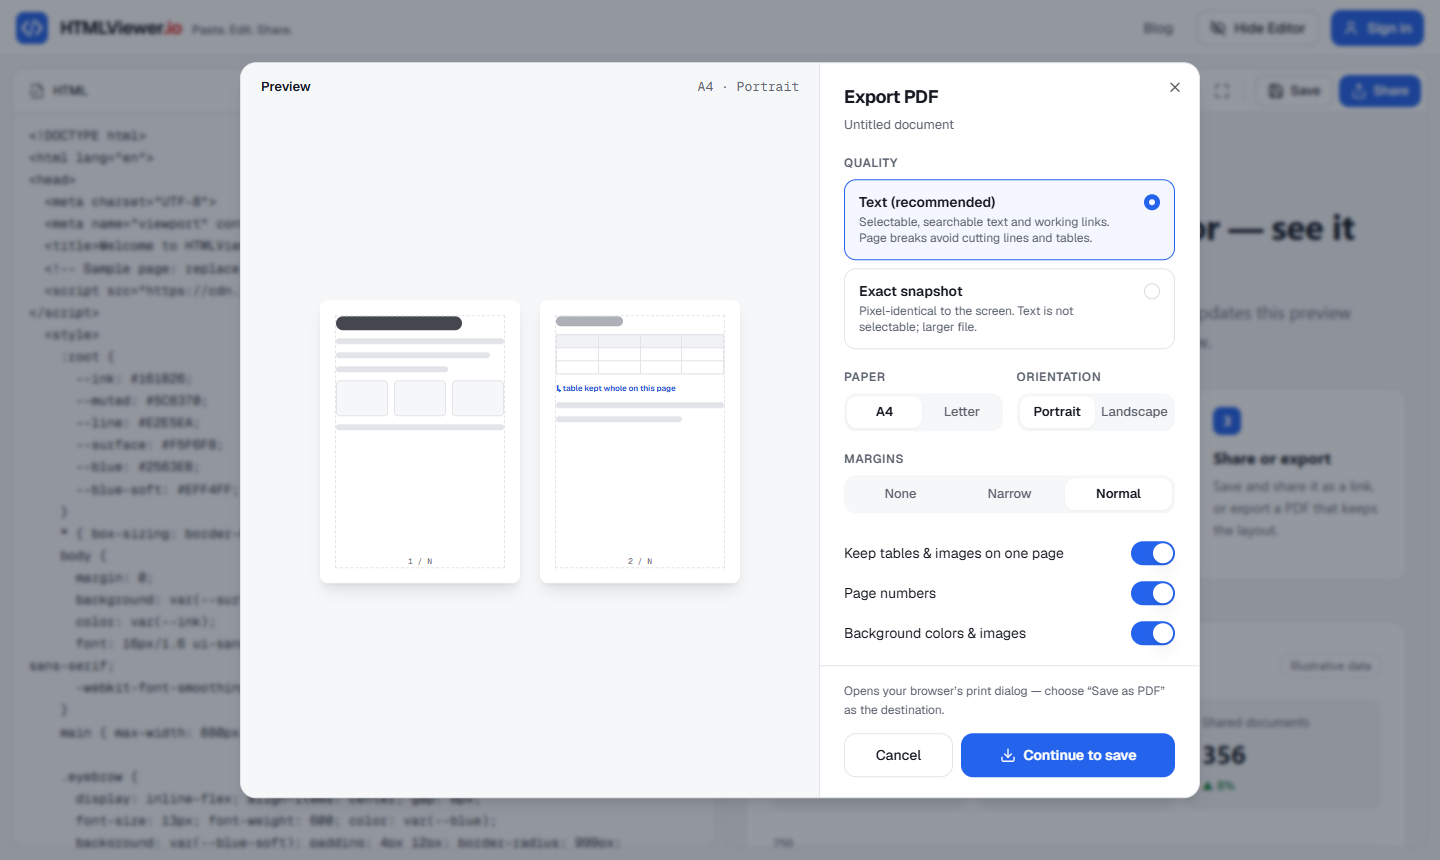
Choose Text (recommended) for searchable text and working links, with the option to keep tables on one page. Choose Exact snapshot when the report is chart-heavy and you want a pixel-identical copy. Landscape usually suits wide dashboards. The HTML to PDF guide covers both modes in detail.
When static hosting fits better
HTMLViewer.io suits one-off and recurring single-file reports under 5 MB. Multi-file report sites, or anything larger, belong on a static host such as GitHub Pages or Netlify Drop; the side-by-side comparison of those options is in how to share an HTML file as a link.
If you're sharing HTML that an AI assistant generated, such as a quick dashboard from ChatGPT or Claude, the same steps apply. See previewing AI-generated HTML for tips on fixing common issues in that output.
Frequently asked questions
Why does my HTML report show no charts or images when someone else opens it?
The report probably references files that live next to it on your machine, such as a _files folder, a plotly.min.js bundle or a folder of PNGs. Re-export it as a self-contained file, or load libraries from a CDN, so everything the page needs is inside the HTML or at a public URL.
How big can an HTML report be on HTMLViewer.io?
Each saved document can be up to 5 MB. Loading chart libraries from a CDN instead of embedding them is usually enough to stay well under that.
Can I share a Plotly chart without hosting it?
Yes. Save it with fig.write_html("chart.html", include_plotlyjs="cdn"), paste the file's contents into HTMLViewer.io, save, and share the link. The chart stays interactive because the page runs JavaScript.
Can I keep a shared report private to my team?
Yes. Instead of a public link, share the document with specific email addresses. Each recipient signs in with Google using the invited address to view it.
Will the shared report update when I re-run my notebook?
Not automatically. HTMLViewer.io stores the HTML you pasted, so after re-exporting you paste the new HTML into the saved document and save it again.
Paste your HTML and see it rendered in seconds — free, no sign-up needed to preview.
Open HTML Viewer